A Framework for Improving Citizen Experience with Social Safety Net Programs
Antony Brydon, December 2021
I’ve been researching what a framework would look like for Citizen Experience (CX), focused on improving delivery of social safety net services. I am impressed how John Doerr’s Speed & Scale breaks down 59 gigatons of carbon plan into six categories, and provides a comprehensive framework for action that government, industry and individuals can swarm around. Biden’s December executive order (17 agencies, 35 commitments) is an interesting start towards a plan.
A framework might focus on $400-$800 billion (depending on whether Medicaid is included) annual federal spend on social safety net programs. It might map the universe program by program, rally private and public players around the framework, measure success as the utilization of every available dollar, then achieve that success by increasing access, organically focusing on underserved communities. Programs would fit in this framework and push the ball forward, but the framework (like Speed & Scale) has value as well.
Here’s a snapshot of a framework. The simple idea is that social programs are about creating opportunity for people, but unlocking the opportunity depends on more effective delivery. The three metrics are Participation, Equity and Accuracy. This Missed Opportunity sets the priorities. The tech work focuses on delivery that improves all three, and the policy work focuses on improving delivery.
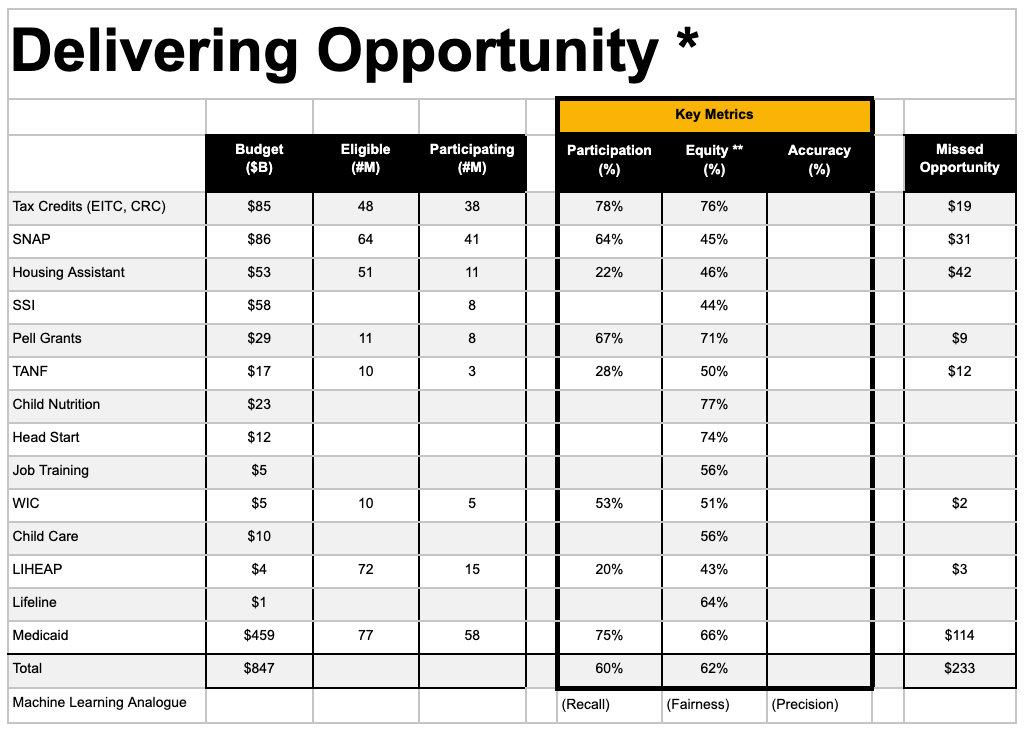
The framework isn’t about expanding the net, but delivering the opportunity that’s already provided for – turning potential energy to kinetic energy. That’s an intentional choice – along with an accuracy metric – both working to garner bipartisan support.
One of the spectacular achievements of Speed & Scale is breaking down a large and intractable problem into discrete chunks that private and public sectors can rally around. Since many safety net programs are administered at the state level, a heat map might show how each state is performing on participation, equity, and access. More importantly, the same map might show the opportunity for each at a state by state level, allowing private and public entities to target states and programs with the greatest opportunity to improve participation, equity, access.

Note: illustrative data
